

Independent GIS Project
April 27, 2019
Note : I do not speak for any organizations. All opinions shared are my own.
Like this post? Tweet about it!
In 2014, the city of San Francisco, through its Department of Public Works, launched an initiative to cut down on human feces complaints in the city. This program is a network of public restrooms that are maintained by the department of public works, and contain safe needle disposal sights, restroom facilities, and pet waste disposal sites. The program, the Pitstop Program, has been lauded as a success, but still, media coverage of the human waste in San Francisco has increased, indicating that general discontent with street cleanliness has increased as well. Human waste on the streets presents a health hazard, as well as general discomfort. At the very least, cleaning this waste is a drain on limited city resources, so programs like the Pitstop program are essential to intercept this waste before it ends up on the streets.
This analysis seeks to determine whether there are certain factors that predispose an area to having more 311 cases regarding human feces. By finding what predisposes a neighborhood to this problem, I hope to determine possible methods of intervention so that feces can be diverted away from the city streets and into a toilet. This analysis will focus on the most recent year of full data, 2018. I will look at data from the census, from other 311 incidents, human waste incidents from prior years, and 911 calls to see if any of these factors predispose a neighborhood to high human waste case volumes.
This analysis will look at both when and where cases about human feces occur to see if the hours of operation and the locations of the Pitstops are effective. This paper will conclude with policy recommendations to improve the Pitstop program.
Background
San Francisco is known for its relatively large homeless population. More than 7,000 people self-reported experiencing homelessness in in 2017, which is slightly less than 1% of the city population. This means that 1 out of every 100 people in San Francisco experienced homelessness during the year. (U.S. Census Bureau, 2016). Of that population, 58% reported being unsheltered (Applied Survey Research, 2017). In the 2015-2016 fiscal year, the city spent more than $241 million on homeless services (Knight and Fagan, 2016).
The Pitstop Program is an initiative by the San Francisco Department of Public Works which aims to provide safe and clean toilet, safe needle drop off locations, and pet waste disposal in areas that are of outstanding need in the city. The program features park restrooms, portable toilets, and JCDecaux self cleaning public toilet facilities. JCDecaux facilities also double as advertising billboards. The facilities kept by the program are “maintained to a standard where parents and guardians would feel comfortable bringing their children” , and are not open at night. Collectively, the restrooms are open from 7 a.m. to 9 p.m. An explicitly stated result of the program is that “complaints about human waste in public spaces around the Pit Stop locations have gone down” (Department of Public Works). This can be checked by analyzing the 311 reports of human waste in the city before and after the program was implemented.
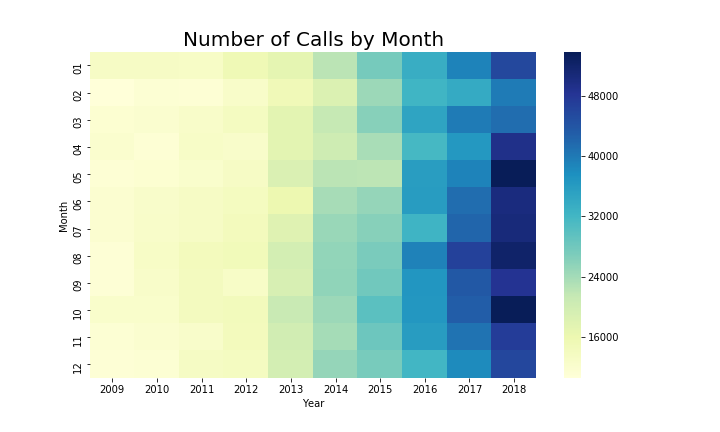
We can see that there has been a clear increase in the total number of calls recieved by the city of San Francisco's 311 department since 2009, and that there does not seem to be any months were there are consistently more calls.
The City of San Francisco makes all 311 reports public. These calls include calls regarding human waste that must be cleaned up. When the Department of Public Works cleans human waste, they power wash the sidewalk where the incident occured. This means that the odor and the appearance of the waste is eliminated, but the process vaporizes the feces and makes it airborne. I have heard anecdotal evidence from some of those experiencing homelessness in the city that the ingestion of airborne feces has caused many of the homeless population in the city to suffer from digestive illness, such as the shigellosis caused by the shigella bacteria. Shigellosis is contracted from contact with feces, and the main sign of infection is diarrhea (Mayo Clinic, 2019). It follows logically that cleaning feces in this manor is dangerous and can potentially lead to more feces, and therefore the best strategy for combating human waste in the streets is prevention.
The Pitstop program is an intervention program designed to mitigate human waste in the streets, therefore saving DPW man hours, and potentially preventing public health problems. Analyzing the effectiveness of the program will help to inform future policy action and potential extension of the program.
Methods
Data for where human feces is occurring and where encampments are was taken from 311 data published by the city of San Francisco. Demographic information was taken from the American Community Survey conducted by the U.S. Census Bureau. 911 call volume was approximated by 911 call volume that was directed to SFFD (San Francisco Fire Department) and was obtained from the city of San Francisco. The locations of the restrooms in the Pitstop program were also taken from the San Francisco Open Data Portal.
All call data (both 311 and 911) was subsetted so that only calls that had locations attributed to them were included in the analysis. Approximately 10% of 311 calls did not have correct locational attributes or any locational attributes at all (where “correct” locational attributes are ones that fall within the boundaries of San Francisco). This is a large enough loss that it is worth noting.
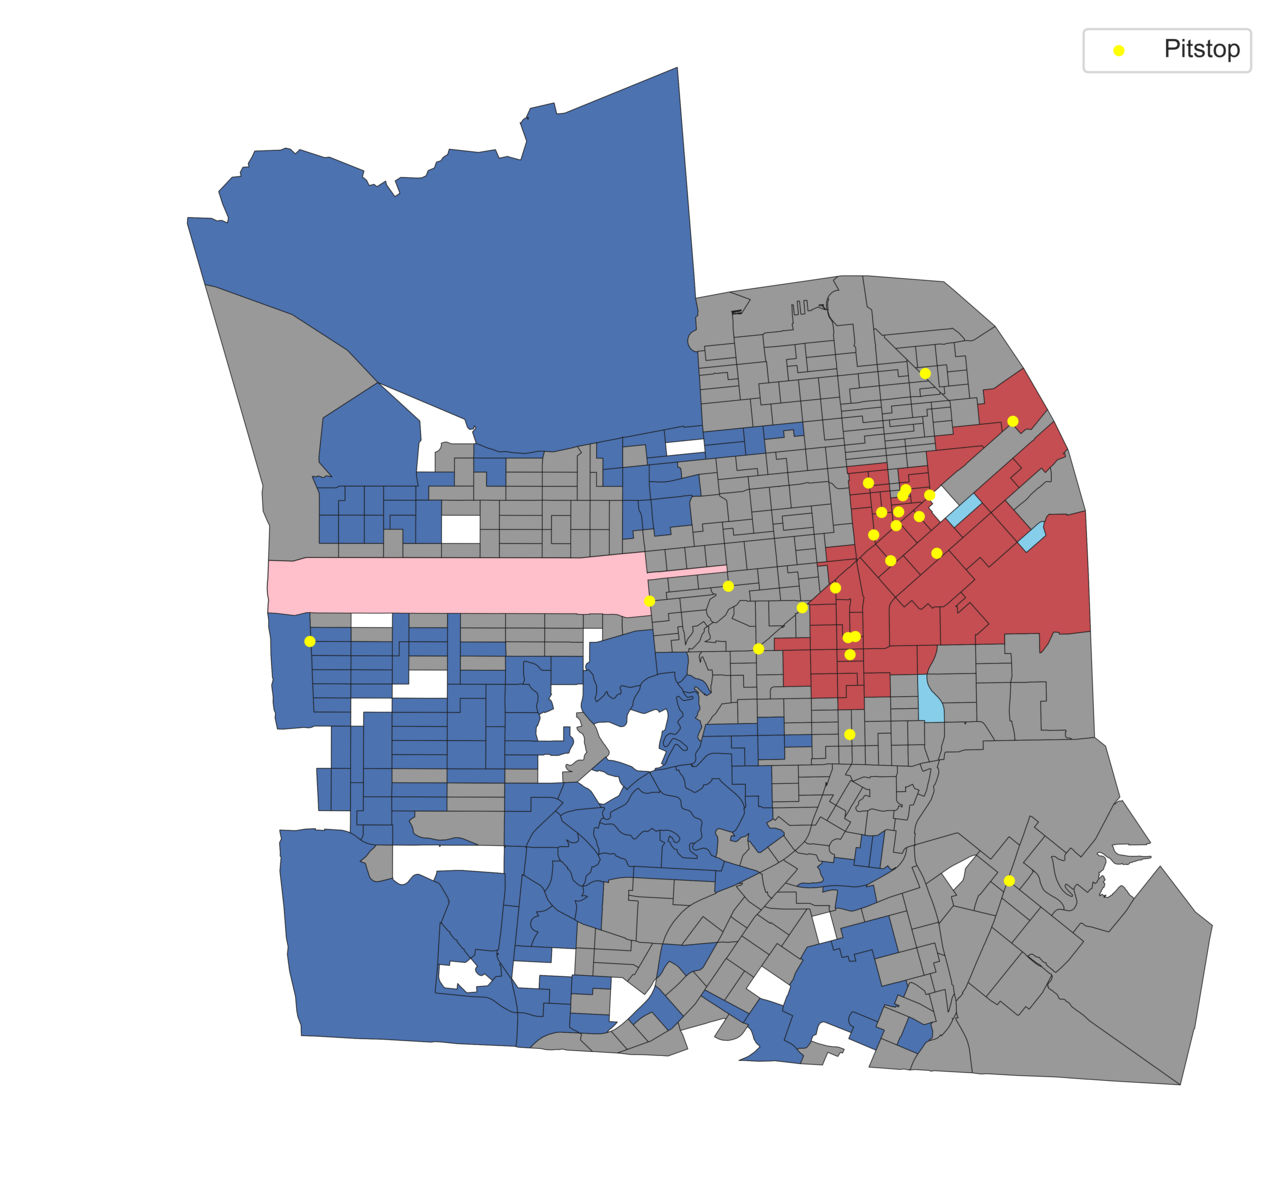
This map shows the result of clustering analysis with the pit stop locations shown in yellow. Blocks that are blue show clusters of low human waster related call volume, whereas red blocks show clusters of high call volumes. Pink and light blue denote outliers, where pink shows an unusually high cluster near low clusters and light blue shows an unusually low cluster near high clusters.
I created a spatial weights matrix using queen contiguity and calculated spatial lag for human waste reports in 2018. I then tested for spatial autocorrelation with Moran’s I, finding I=0.62437 with P=0.001. This indicated global spatial autocorrelation. To look for local autocorrelation, I calculated LISAs. I ran OLS spatial diagnostics to confirm this Moran’s I value and ran both Lagrange multiplier test for spatial lag model as well as Lagrange multiplier test for spatial error model, and both were significant so I chose to create a generalized method of moments model to explain human waste calls.
In my regression, I included demographic information as to the percentage of population that identifies as white, the total number of vacant units, the total number of 911 calls to the fire department, the total number of 311 calls, the total number of calls regarding encampments, and the population density, all from 2018, which is the last full year of data for both 311 calls and 911 calls, and all aggregated to the census block level. I also chose to include the number of calls in each block regarding human waste from 2013, which was the year before the Pitstop program was implemented and presumably the year of data that the Pitstop locations were based upon.
Discussion
This analysis shows that there are strong temporal trends across any given day and strong spatial autocorrelation for human feces complaints. This means that people are more likely to report human waste clean up sites during between 7 a.m. and 9 p.m. in the Tenderloin and the SoMa neighborhoods. There are many possible explanations for these trends, some of which I will discuss in this section.
Temporal analysis using 311 calls is difficult considering the time associated with each datum is when someone reported seeing human feces, not when the production of said feces occured. At night, when the Pitstop locations are closed, people who would be reporting human waste incidents are at home. This means that when people are commuting to work and active in the morning, they see waste that accumulated overnight when the restrooms were unavailable, and call to report this accumulated waste. This is one possible explanation of the spike in call volume we see in Figures 3 and 4, and could be tested by extending Pitstop hours into the night, ideally so that some located at the centers of hotspots are open 24/7, and seeing what effect this policy change has on call volume. Given this explanation, I recommend that the Department of Public Works extend the hours of the existing Pitstop locations or open more locations in the neighborhoods where there are feces hot spots.
Additionally, deploying additional programs or giving more funding to existing programs that serve to combat homelessness could be an effective way of remove human waste from the streets of San Francisco. Most people, when afforded the opportunity, will chose to use a restroom over relieving themselves outdoors. The most obvious solution to a human waste problem is to ensure that all people have access to restrooms at all times, be it through an extensive public restroom network, or through private restrooms. Giving additional resources to effective programs designated to transition those living outdoors to living indoors could be another way to mitigate human feces on the street.
Ideally, I would have included data for 911 calls directed to police department precincts as well as 911 calls directed to the fire department. The city of San Francisco releases 911 call data, but it is not georeferenced and the address associated with each call were not such that I could geocode them. I decided to leave this dataset out of my analysis because I could not aggregate that data to the block level. Future analysis may be done using police districts as the unit of analysis to allow for 911 data from the SFPD to be included.
Future analysis of human waste should include a time series analysis to see how the clusters of human waste calls are moving on a more granular time scale and spatial unit to determine whether fixed restroom locations are ideal to combat waste issues. Sociological research with those experiencing homelessness to see if they find the Pitstop program to be effective should also be conducted. It may also be worthwhile to survey San Francisco residents to see which demographics participate in 311 and where they live. It may be useful to see if some demographics or residents of some neighborhoods are more likely to participate in 311 reporting, and to consider that when looking at where to implement more Pitstops.
Additional analysis of the Pitstop program’s effectiveness may also include 311 calls regarding needles found on the street. The Pitstop program includes safe needle disposal sites, so it would be interesting to see if the implementation of the program coincides with changes in call patterns about needle disposal. The Department of Public Works did not make specific claims about removing needles from the street, so I chose not to look at that data in this analysis. It may also be worthwhile to look at public health data, such as cases of shigella or E. Coli to see if variation in occurances of these bacteria is related to where there are high incidents of human waste on the streets.
About the Author

Violet loves making maps and satisfying data visualizaitons. Violet also love getting down and dirty with data. See more about her here.
PostGIS Python 311 Data data visualization
Made with ❤ in Hollister, CA
Powered by Gatsby in Oakland, CA