

Mapping Oakland's Crows
January 24, 2023
Note : I do not speak for any organizations. All opinions shared are my own.
Like this post? Tweet about it!
Check out the code for this project here!
As I age, I feel myself sliding into becoming a bird-watcher. As any budding birder would, I started looking into the data available through eBird. As a first test of what it was like to work with the data (accessed through gbif.org), I decided to map the areas in Oakland where there are relatively high observances of crows (which for this analysis, I defined as members of the genus Corvus).
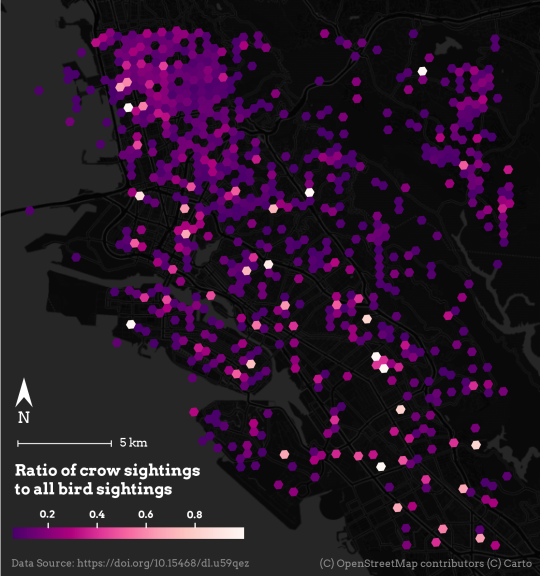
A heatmap showing areas where there is the highest ratio of crow sightings to all bird sightings. Lighter colors show a higher ratio. Only the top 34% of hexagons by crow sighting ratio are visible.
I defined areas with lots of crows as areas where there was a high ratio of Corvus observances relative to the total observances in that area. I bucketed the raw data into hexagonal bins using Uber's H3 library, and calculated that ratio for each bucket. I took the top 34% of hexagons, and used those to create my maps.
Something I wanted to try out with this project was making maps with artistic, custom markers in Python. To try this out, I thought I would visualize areas with higher than average crow observations with flocks of crows flying over the areas.
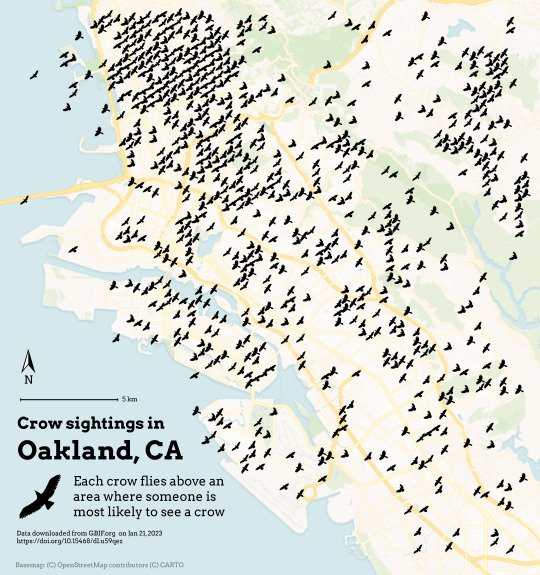
The final crow flight map
Data source: GBIF.org (21 January 2023) GBIF Occurrence Download https://doi.org/10.15468/dl.u59qez
About the Author

Violet loves making maps and satisfying data visualizaitons. Violet also love getting down and dirty with data. See more about her here.
Python geopandas eBird matplotlib
Made with ❤ in Hollister, CA
Powered by Gatsby in Oakland, CA