

Bus Crowding Explorer
April 29, 2019
Note : I do not speak for any organizations. All opinions shared are my own.
Like this post? Tweet about it!
For my senior capstone project I created a new data visualzation tool for the MBTA as a part of the Office of Performance Management and Innovation (OPMI).
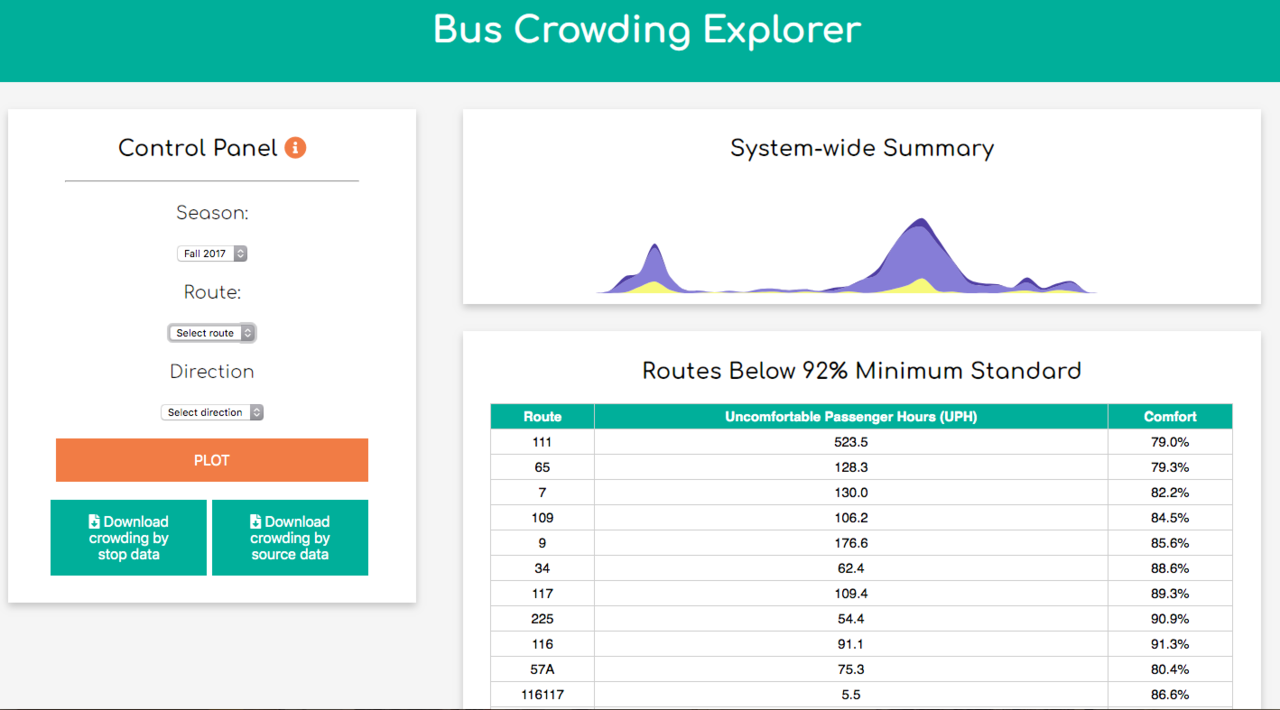
The start page of the bus crowding explorer
How is crowding measured?
Crowding measurement is.. complex. On the most basic level, bus crowding is defined by the MBTA Service Delivery Policy as a function of vehicle occupancy in terms of passenger time. This means that the actual measurment of crowding is in uncomfortable passenger hours, meaning the cummulative time spent by passengers in uncomfortable conditions During high occupancy times, all passengers are considered uncomfortable if a vehicle is at 140% of its seated capacity (meaning that for every 3 people sitting, another person is standing). When the vehicle is between 125% and 140% seated capacity, all standing passengers are considered uncomfortable and their time is counted for the metric. For times that aren't high occupancy, if the vehicle is at 125% of seated capacity or higher, all passengers are considered uncomfortable. Otherwise all passengers are considered comfortable.
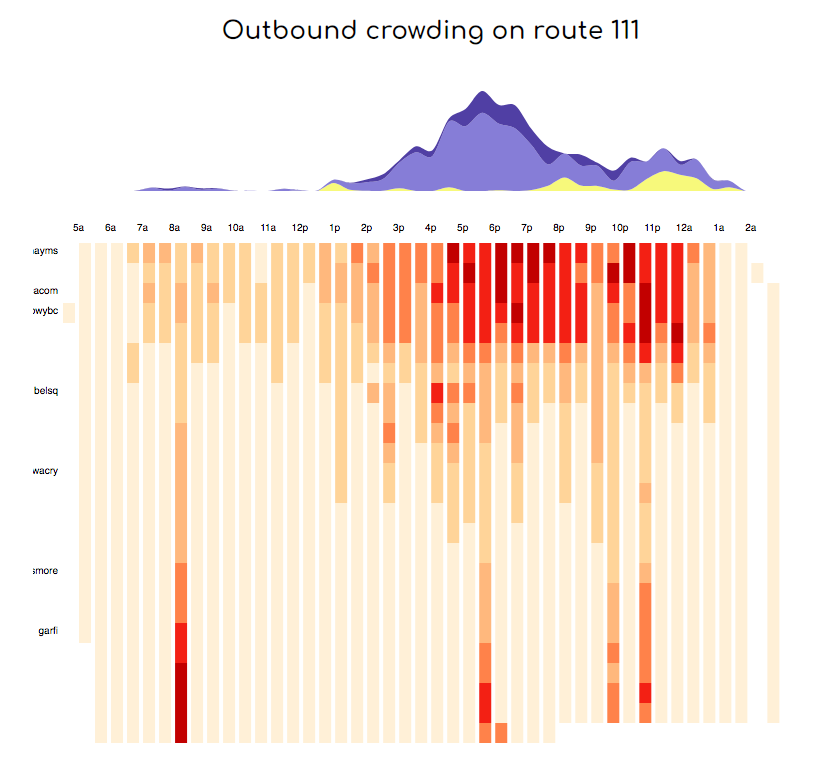
Outbound crowding on route 111 shows intense crowding starting around 3 p.m. at the beginning of the route. By looking at the streamgraph, we can see crowding on this route is caused mostly by bunching and transfers (shown in light purple).
Why crowding matters
Reducing trips made by single occupancy vehicles is key to reducing emissions in the US. The sector that contributed most to US greenhouse gas emissions in 2016 was the transportation sector, contributing almost 30% of greenhouse gas emissions. A key way to cut down on these emissions is for single occupancy vehicle trips to be made on ‘cleaner’ modes of transport — like public transportation, walking, or biking. Cities that wish to reduce their emissions therefore must look to making improvements in public transit in order to cut down on single occupancy vehicle trips.
Getting individuals to make the switch from private single occupancy vehicle transportation to public transportation requires users to find the mode switch to be, among other factors, a convenience. When considering a mode shift, comfort is one of the many factors that a potential rider will consider. Perceived comfort can be linked to dissatisfaction with standing and not being seated, with lessened ability to make use of time during a public transit trip (i.e. reading a book), and the physical closeness to other travellers. As passenger comfort is an inherently subjective metric with wide variation, it can be difficult for transit authorities to measure and improve. Factors that contribute to perceived comfort can be linked to crowding, which can be easier for agencies to measure. Crowding is also a good metric to identify demand in certain areas at certain times; if a bus along a particular route is crowded, that means that the origin destination pair that route serves is in high demand during the time segments where it is chronically crowded.
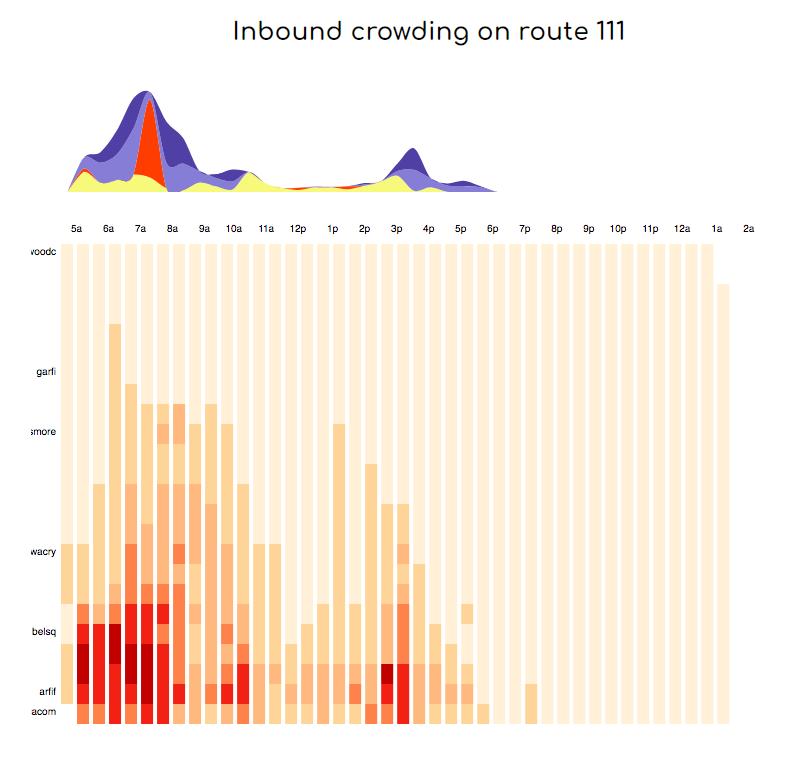
Inbound crowding on route 111 shows intense crowding throughout most of the morning at the end of the route. By looking at the streamgraph, we can see a spike in crowding caused by insufficient planned frequency (in red) around 7 a.m..
Crowding must be a consideration when transit authorities seek to gain ridership, or when metropolitan areas seek to reduce emissions because crowding not only points to where passengers are less comfortable, but also to where the system is in high demand. Crowding metrics can show planners whether a system, under its current operating schedule, can handle an increase in passenger load. If the system, at peak demand times, is already at maximum capacity, then the vehicles within the system cannot handle an increase in passengers. Simply put, a crowded system cannot handle any new passengers without making changes to the operations. If metropolitan areas choose to make policy to incentivize mode shift from single occupancy vehicles, they must make sure to adequately provide for improvements in public transit systems to prevent overcrowding. This includes addressing crowding in vehicles and making sure agencies have the capacity to take an increase in ridership.
In addition to attracting potential riders, improvements in passenger comfort benefit current riders. Reductions in crowding have been shown to be more beneficial for commuter perception than increases in reliability. Crowding in public transit has been shown to increase stress levels of riders. Crowding conditions affect riders’ ability to choose optimal work times, their ability to be productive during their trip, and the cost they associate with their journey.
Special thanks to:
- Arthur Prokosch, project management and support
- Laura Riegel, opinion-giver and transit data expert
About the Author

Violet loves making maps and satisfying data visualizaitons. Violet also love getting down and dirty with data. See more about her here.
D3.js PostgreSQL php JavaScript data visualization
Made with ❤ in Hollister, CA
Powered by Gatsby in Oakland, CA